


The hassle of making charts is over – if you know the way
Nowadays, we all deal with tons of data and information that need to be presented simply and attractively to others. Using After Effects Chart Animations can help present data more clearly and professionally. But creating precise, easy-to-understand charts that both look good and convey the right information usually takes a lot of time and effort. And if you want to change the data frequently or have slick animations, things get even more complicated.
You might have thought of doing this directly in After Effects, but honestly, it’s not that simple. Manually setting up data, animations, and chart details can be time-consuming, tedious, and full of headaches.
Fortunately, there are ways to reduce all these difficulties and help you create attractive charts faster and easier—without wasting hours of your time.
I just wanted one chart – why is it so hard?
You can build charts inside After Effects, but everything has to be done manually. What does that mean? You need to draw the shapes and lines with tools like Shape Layer or Pen Tool first, then animate each bar or data point separately. If your data changes, you have to adjust everything again. Even if you use scripts and expressions, a simple project can turn into a complicated mess with lots of layers, keyframes, and fine settings.
Now imagine you want to create a dynamic chart that automatically updates with a CSV file. Or a self-animating line graph that adjusts with every change in data. Accomplishing that without specialized tools is nearly impossible. Projects done with After Effects are especially challenging when there are frequent updates to the data or when deadlines are tight. Those types of projects require planners, and that is not what After Effects is made for.
Everything you’ve been looking for is right here
Imagine a way where you just import your data, pick a template, and everything is built automatically—from chart shapes and styles to animations, colors, and labels. No more long keyframing or messing with shapes. You can easily edit your data or swap in a new CSV file, and everything updates itself. Plus, you get a live preview to see how it looks right away!
Isn’t that exciting? It really frees up your time, reduces fatigue, and lets you focus on creativity and design instead of struggling with tools. It’s like having a helping hand that unties all the knots!
Ready? Because I’m about to show you something that will truly transform your workflow!
If you’d like to go beyond this content and dive into the different types of After Effects tools, don’t miss the link provided below.
Tools that turn your work around
If you want to improve your workflow with fast and flexible After Effects Chart Animations, these plugins are exactly what you need. These are designed specifically for making charts and infographics inside After Effects, removing the hassle and complexity of data-driven animation. Just input your data, pick a suitable template, and let them do the rest. Each plugin has unique features that come handy in your projects, helping you deliver faster and with better quality.
Let’s see how each of these tools can make your work life easier!
🎯 1. Aescripts – Chartist
The problem: Making clean, professional-looking bar or line charts quickly was usually time-consuming.
The solution: Chartist is designed exactly for this. It offers one of the quickest solutions for creating professional After Effects Chart Animations without any coding. With this plugin, you can easily create sleek, clean charts without manual drawing. It focuses on speed and simplicity—just import data and get a fully editable line or bar chart ready instantly. Perfect for presentations and graphic projects, everything is animatable with no scripting or AE complexity—just a few clicks and you have a stylish graph that adds personality to your project.
📊 2. Infographics Toolkit
The problem: Creating a complete presentation with multiple charts, transitions, logos, and coherent animations was time-consuming and project management was tricky.
The solution: Infographics Toolkit is a full toolbox for building infographics, with automatic final presentation building. With coordinated styles and transitions, it enhances your After Effects Chart Animations for polished presentations. It includes coordinated templates and graphic styles—logo intros, charts, transitions, and endings are all ready. Just import data and hit “Build Final.” Each chart and animation has a dedicated theme matching colors, motion, and style. Everything is expression-driven, so with a few clicks, you can change colors, text, data, and the whole graphic structure. For projects with multiple charts and sections, this plugin is a treasure.
📈 3. AEInfoGraphics
The problem: Often charts need to be dynamic—automatically updating with data changes. But that’s hard and slow in After Effects.
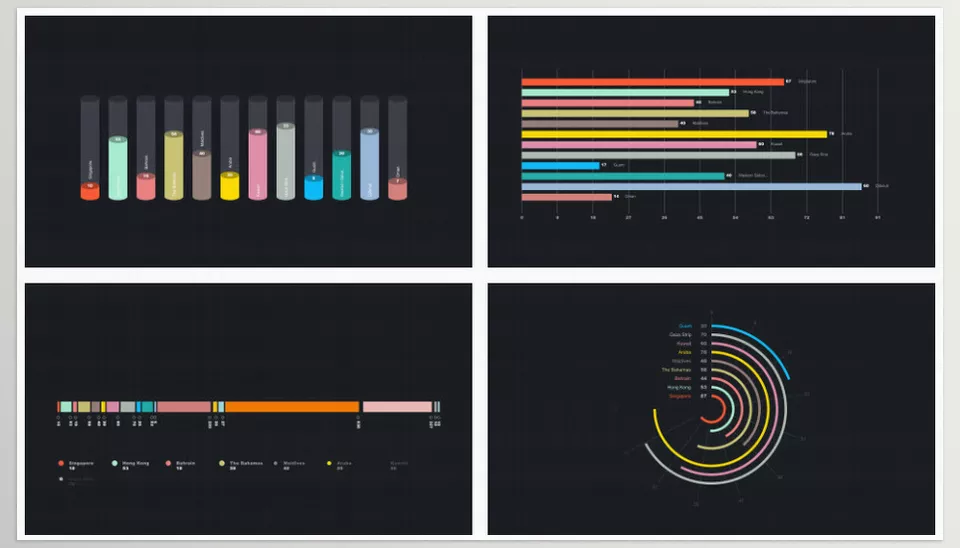
The solution: AEInfoGraphics lets you easily import CSV files or create data directly in its panel and build charts with one click. It’s one of the best tools for dynamic and data-driven After Effects Chart Animations. It’s a very user-friendly extension where you can write data or drop a CSV, choose from 12 chart types (bar, pie, combo, etc.), and customize animation timing, colors, label types (percent or number), and overall themes. It also offers live preview so you see the output before building. This is very practical for people dealing with frequent data updates.

📉 4. Dynamic Line Chart (DLC)
The problem: Building advanced line graphs with multiple data series, zoomable axes, and moving labels in After Effects is difficult and manual.
The solution: Dynamic Line Chart is made for line graphs where you need precise control and advanced features beyond simple charts. DLC lets you import data from CSV, have multiple axes (e.g., dual Y-axes), zoom, set line colors and thickness, and add many elements like markers, labels, guides, error bars, and colored zones. If your projects are data-heavy and you want accurate, responsive, and fully controllable charts, DLC is fantastic.
Comparison of Top After Effects Chart Animation Plugins
Here’s a comparison of top plugins designed specifically for After Effects Chart Animations.
| Tool Name | Main Use Case | Key Features | Ideal For | Data Input | Animation Support |
|---|---|---|---|---|---|
| Chartist | Simple bar and line charts | Fast setup, clean professional look, easy editing, no scripting needed | Quick charts for presentations | Manual input | Basic animation support |
| Infographics Toolkit | Complete infographic presentations | Multiple chart types, transitions, logo intro/outro, coordinated styles, expression-driven | Complex infographic projects | Manual input | Automatic coordinated animations |
| AEInfoGraphics | Dynamic charts with CSV support | CSV import, 12 chart types, live preview, customizable colors, labels, timeline control | Frequent data updates, interactive charts | CSV or manual input | Timeline-based animation |
| Dynamic Line Chart (DLC) | Advanced line charts with multiple axes | Multi-axis support, zoom, markers, guide lines, error bars, colored regions, full control | Scientific or data-heavy projects | CSV input | Advanced animation features |
Time to build smarter and faster!
Now that you know these powerful tools, you can create professional charts and infographics more easily and quickly than ever. Focus on creativity and correct data presentation instead of wasting hours on complex manual animation and data updates.
With these plugins, professional and clean work gets done in the simplest way possible, and any project you tackle will be ready with high quality and speed. Just pick the tool that fits your needs and see how your workflow transforms. Start creating stunning After Effects Chart Animations today and save hours on your projects.
So what are you waiting for? Start now and let these plugins help you save time and energy for creating amazing and captivating work!
To explore the different categories of After Effects tools in depth, see our Ultimate Guide to After Effects Tools Article.